Graph Items
Graphs and charts help you visualize data collected from participants. To create a graph, you first select a graph type that best fits your data, then connect it to one or more inputs. Inputs can be answer items (like questions participants answered), computed values, or data bins. Each graph has settings that control how it displays data and styling options to customize its appearance.
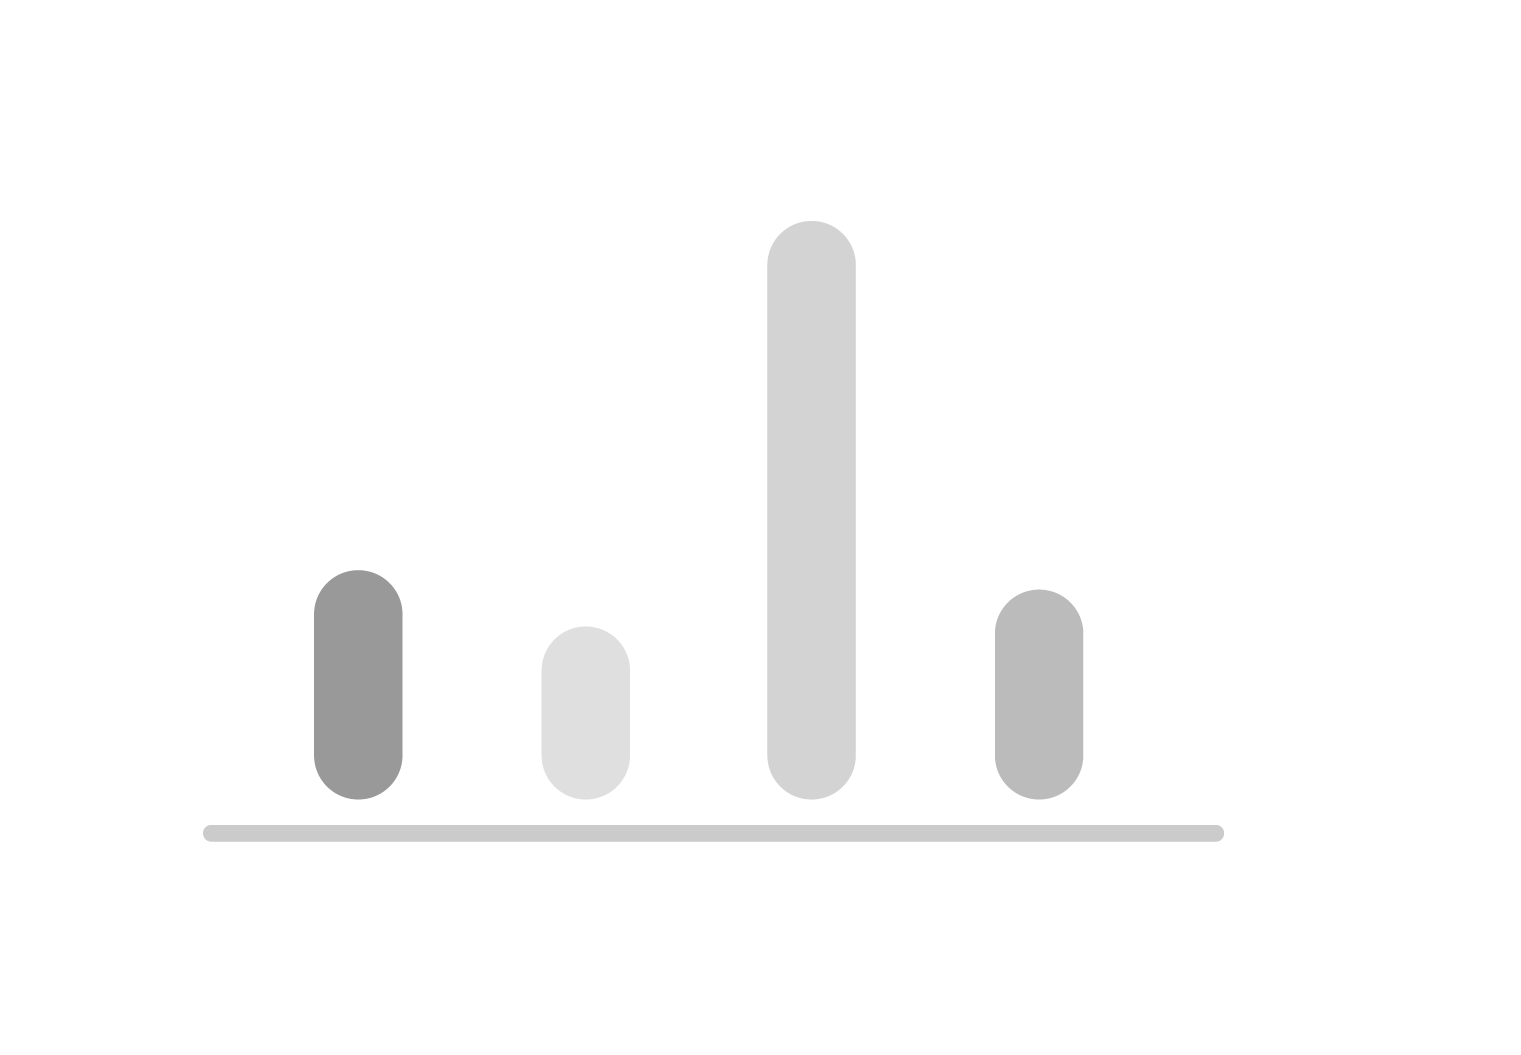 Bar Chart
Section titled “ Bar Chart”Use a bar chart when you want to show how many times each answer option was selected. This is perfect for multiple choice questions, dropdown selections, or any question where participants choose from a list of options.
Inputs
Section titled “Inputs”Compatible answer items: Selector, Select One (Multiple Choice), Select List (Dropdown), Select All (Checkboxes), Country
Also supports: Computed values, Data bins
Settings
Section titled “Settings”| Setting | What it does |
|---|---|
| Orientation | Choose whether bars go up and down (vertical) or left to right (horizontal) |
| Method | Display counts (absolute) or percentages (relative) |
| Sort by | Arrange bars by label name, highest values first, or lowest values first |
| Max bars | Limit how many bars to show (0 means show all) |
| Hide others | When max bars is set, hide remaining categories in an “others” group |
| Merge inputs | Combine data from multiple questions into one chart |
| Show values | Display the numbers on top of each bar |
| Show labels | Display the category names on the chart |
| Show sample counts | Display how many responses were included |
| Method (for counts) | Count by individual answers or by number of participants |
Styles
Section titled “Styles”| Setting | What it does |
|---|---|
| Bar color | Choose the color for the bars |
| Highlight color | Choose the color for highlighted or selected bars |
| Text color | Choose the color for text labels |
| Axis color | Choose the color for the chart axes |
| Font size | Set text size to small, medium, or large |
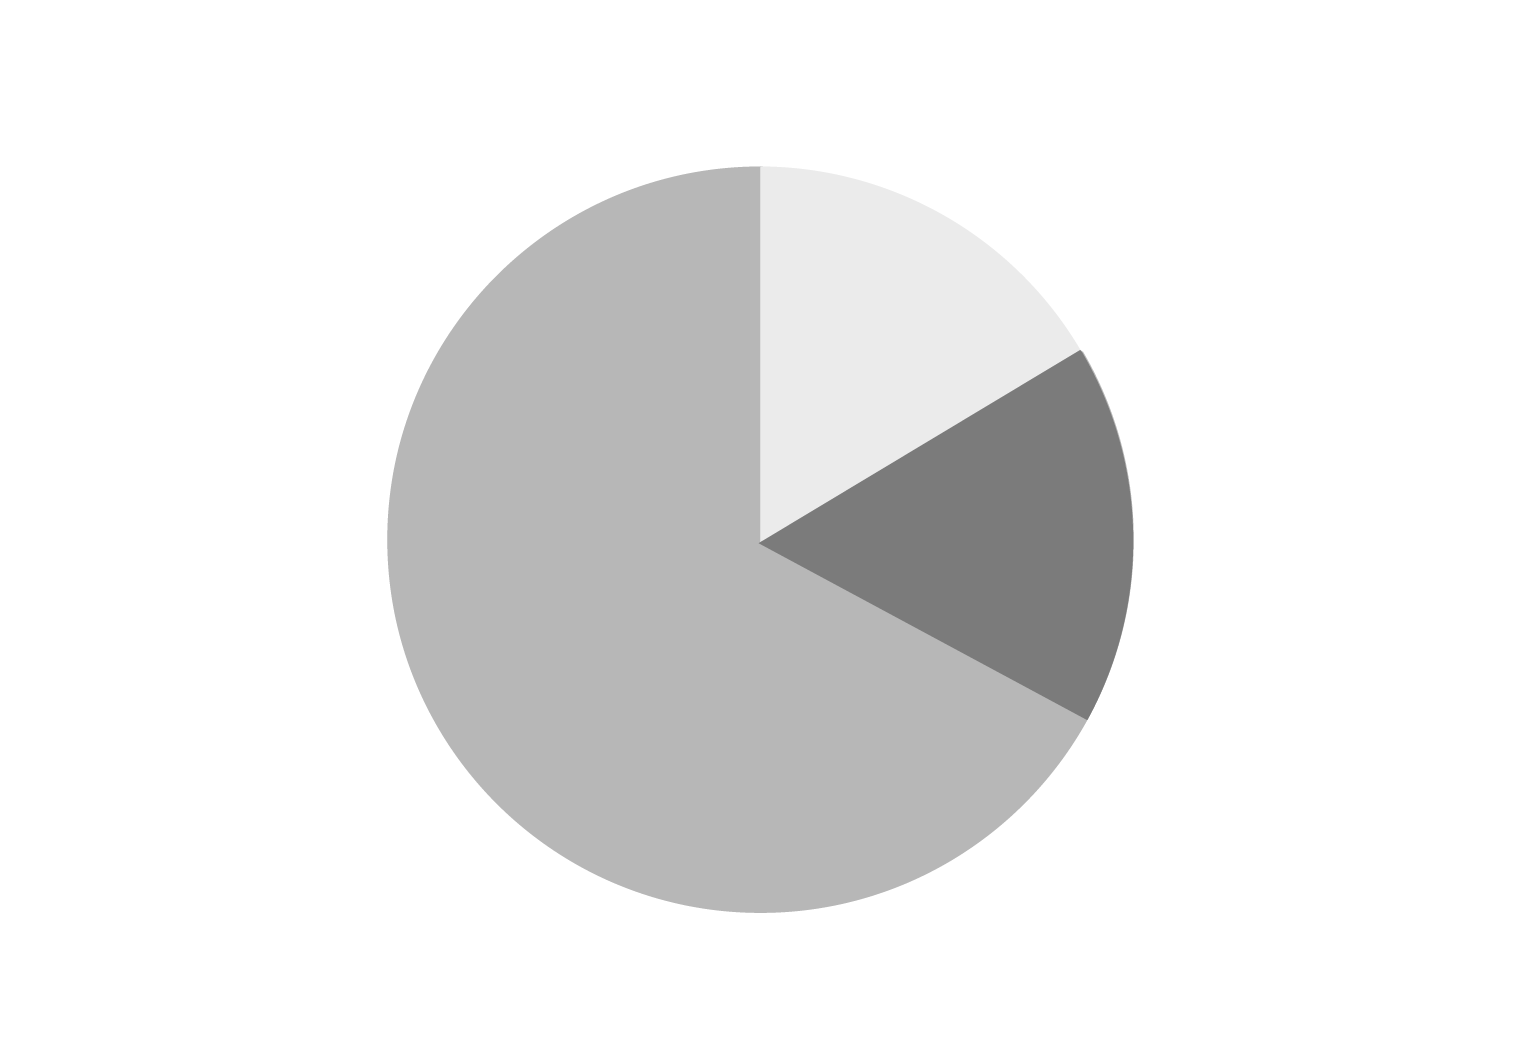 Pie Chart
Section titled “ Pie Chart”Use a pie chart to show the proportion of each answer option as slices of a circle. This works well when you want to quickly see which options are most common.
Inputs
Section titled “Inputs”Compatible answer items: Selector, Select One (Multiple Choice), Select List (Dropdown), Select All (Checkboxes), Country
Also supports: Computed values, Data bins
Settings
Section titled “Settings”| Setting | What it does |
|---|---|
| Method | Display counts (absolute) or percentages (relative) |
| Label placement | Place labels inside or outside the pie slices |
| Show values | Display the numbers on each slice |
Styles
Section titled “Styles”| Setting | What it does |
|---|---|
| Color palette | Choose the colors for each slice of the pie |
| Text color | Choose the color for text labels |
| Font size | Set text size to small, medium, or large |
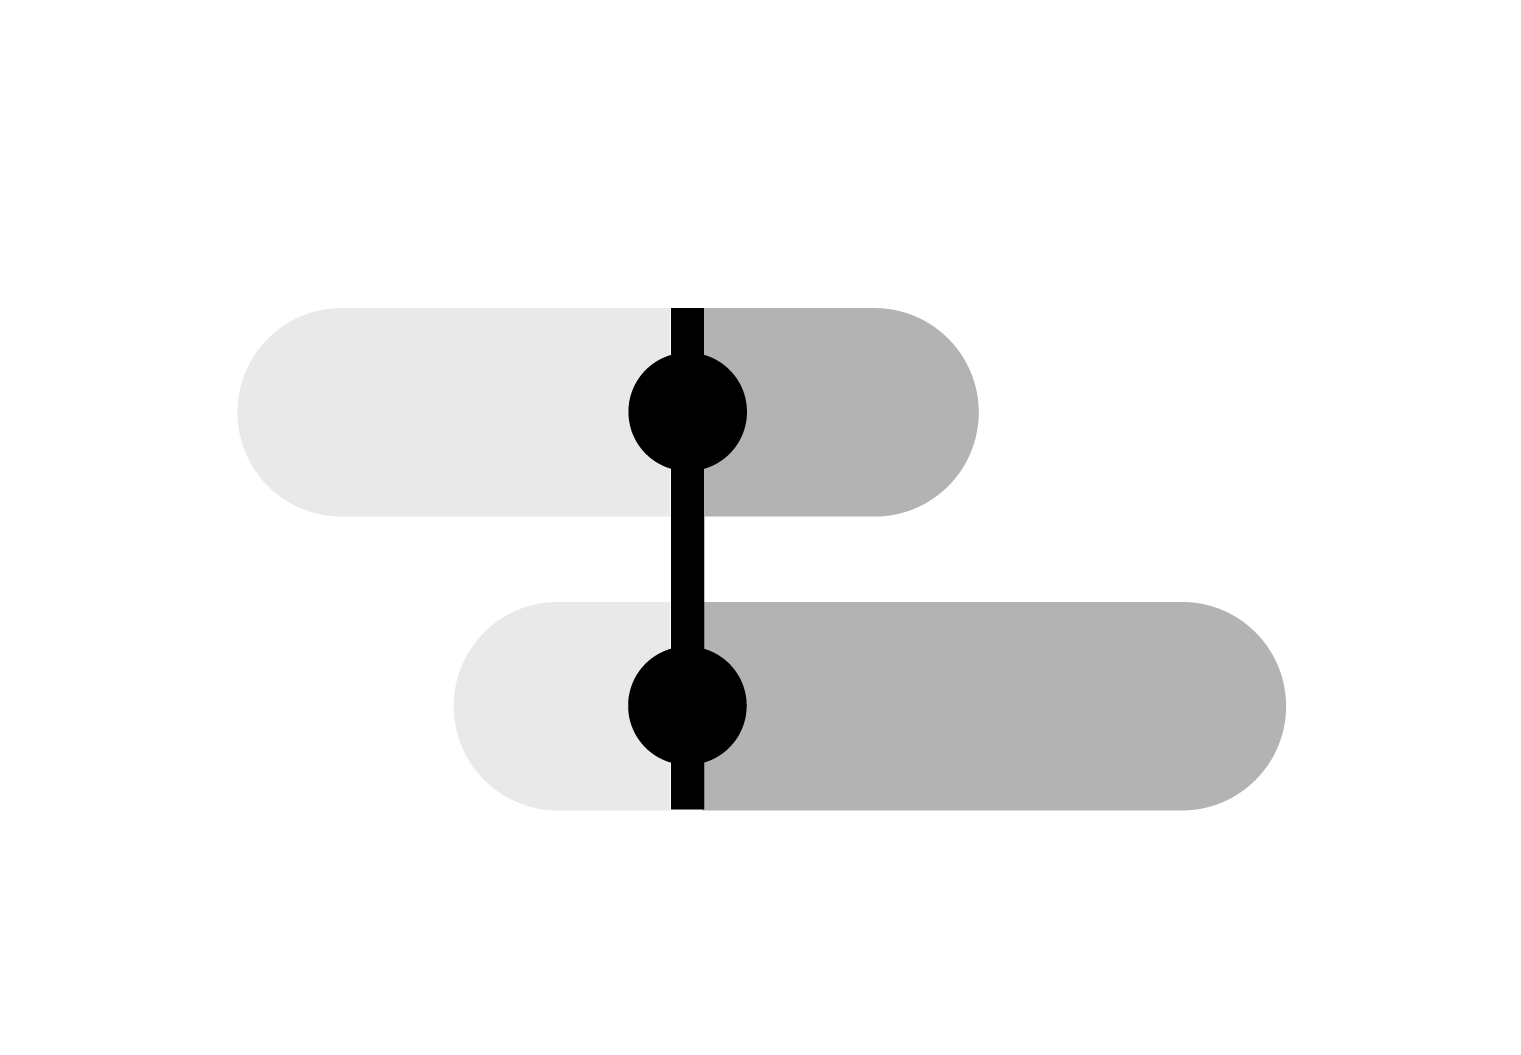 Group Chart
Section titled “ Group Chart”Use a group chart to compare multiple sets of numbers side by side. This is useful when you have numeric data and want to see how different groups compare.
Inputs
Section titled “Inputs”Compatible answer items: Number
Settings
Section titled “Settings”| Setting | What it does |
|---|---|
| Orientation | Choose whether bars go up and down (vertical) or left to right (horizontal) |
| Method | Display counts (absolute) or percentages (relative) |
Styles
Section titled “Styles”| Setting | What it does |
|---|---|
| Below color | Color for bars that are below a reference value |
| Above color | Color for bars that are above a reference value |
| Text color | Choose the color for text labels |
| Value text color | Choose the color for the numbers displayed on bars |
| Highlight text color | Choose the color for text on highlighted bars |
| Font size | Set text size to small, medium, or large |
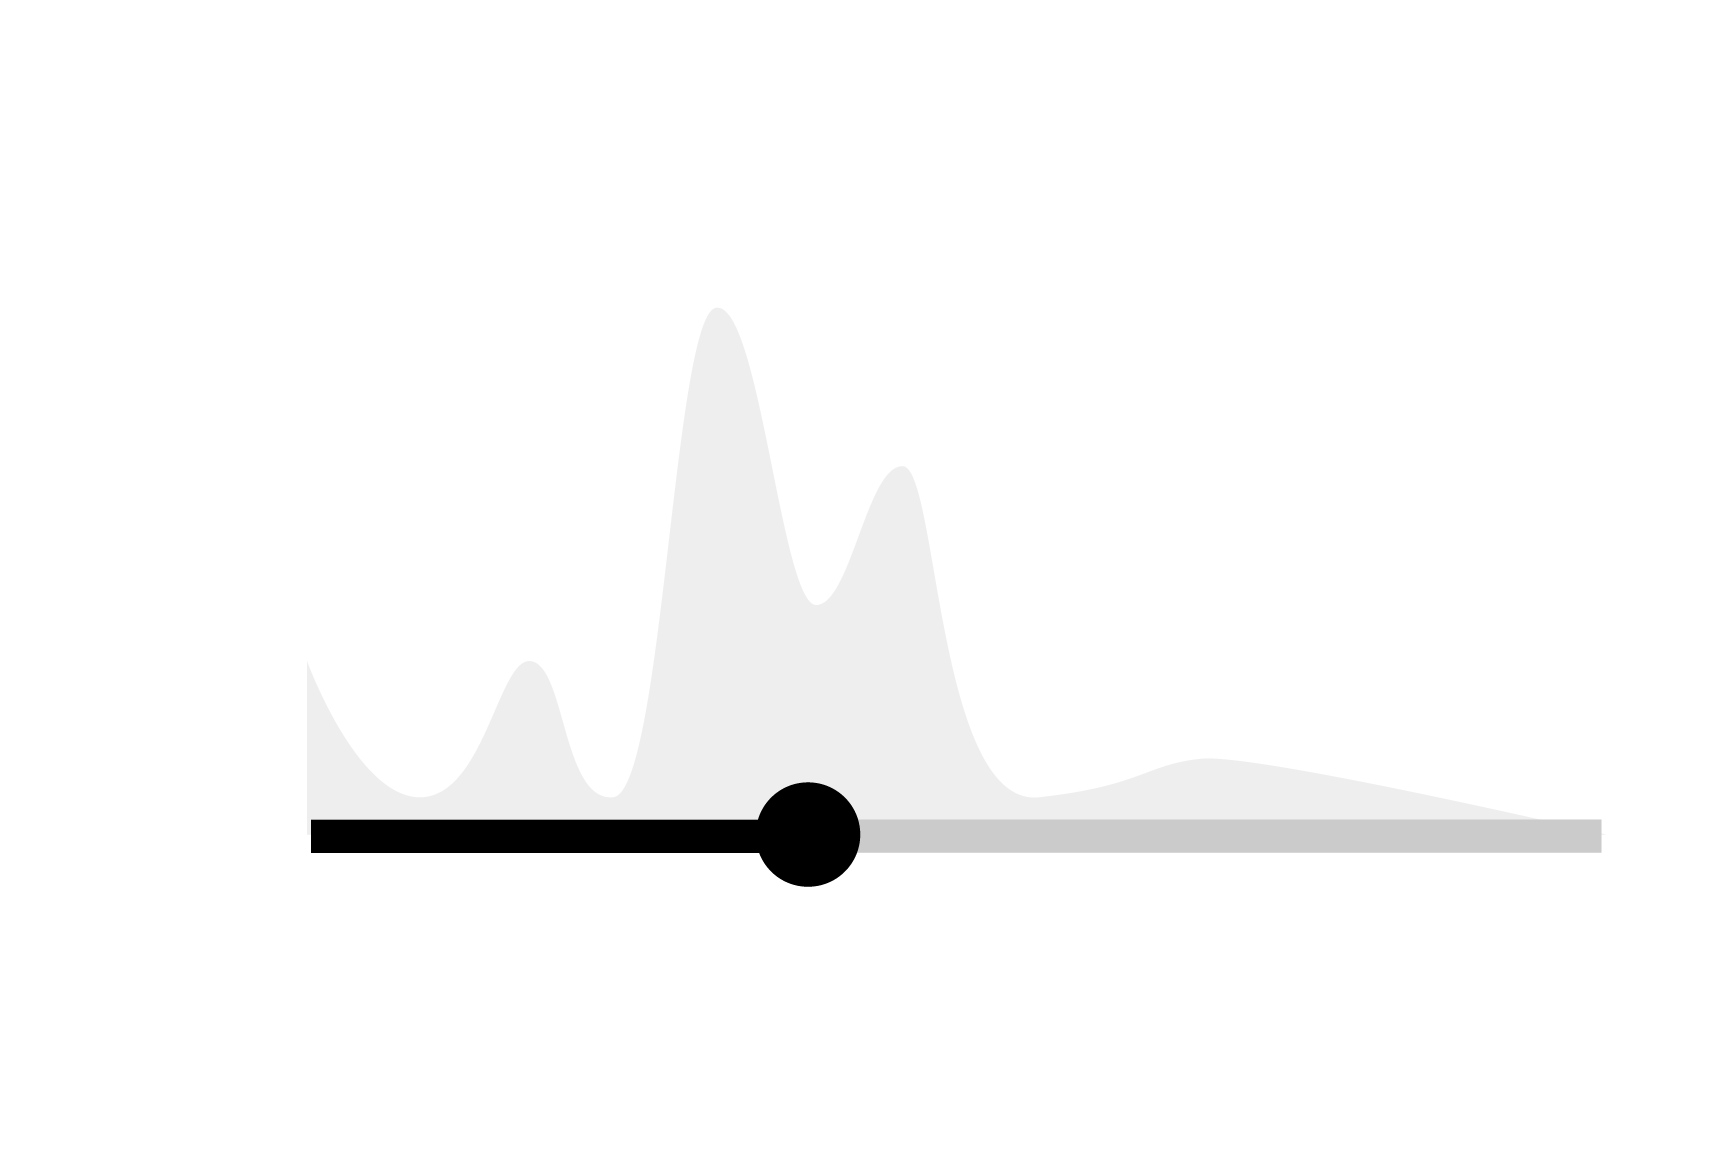 Histogram
Section titled “ Histogram”Use a histogram to show how numeric values are distributed across a range. This is perfect for slider questions, ratings, or any numeric input where you want to see the pattern of responses.
Inputs
Section titled “Inputs”Compatible answer items: Slider, Rating, Number
Also supports: Computed values, Data bins (must return an array of numbers)
Settings
Section titled “Settings”| Setting | What it does |
|---|---|
| Orientation | Choose whether bars go up and down (vertical) or left to right (horizontal) |
| Bins count | Number of bars to divide your data into (more bars = more detail) |
| KDE bandwidth | Adjusts the smoothness of the density curve overlay |
| Show values | Display the numbers on the chart |
| Show counts | Display how many responses are in each bar |
| Unit | Add a unit label (like ”%” or “points”) and choose where to place it |
Styles
Section titled “Styles”| Setting | What it does |
|---|---|
| Highlight color | Choose the color for highlighted sections |
| Track color | Choose the color for the background track |
| Density area color | Choose the color for the smooth density curve |
| Text color | Choose the color for text labels |
| Highlight text color | Choose the color for text on highlighted sections |
| Font size | Set text size to small, medium, or large |
 Distance Plot
Section titled “ Distance Plot”Use a distance plot to show how far responses are from a target or “true” value. This helps visualize accuracy or deviation from an expected answer.
Inputs
Section titled “Inputs”Compatible answer items: Slider, Rating, Number
Settings
Section titled “Settings”| Setting | What it does |
|---|---|
| Orientation | Choose whether the plot goes up and down (vertical) or left to right (horizontal) |
| Method | Display counts (absolute) or percentages (relative) |
| True value | Set the target or correct value to compare against |
| Show Average | Display the average of all responses |
| Bandwidth | Adjust the thickness of the line showing the distribution |
Styles
Section titled “Styles”| Setting | What it does |
|---|---|
| Highlight color | Choose the color for highlighted sections |
| Axis color | Choose the color for the chart axes |
| Tick line color | Choose the color for the small marks on the axes |
| Line color | Choose the color for the main distribution line |
| Text color | Choose the color for text labels |
| Value text color | Choose the color for displayed numbers |
| Highlight text color | Choose the color for text on highlighted sections |
| Font size | Set text size to small, medium, or large |
 Leaderboard
Section titled “ Leaderboard”Use a leaderboard to rank participants by their scores or results. This creates a competitive display showing who performed best.
Inputs
Section titled “Inputs”Compatible inputs: Computed values, Data bins
Settings
Section titled “Settings”| Setting | What it does |
|---|---|
| Order | Sort participants from highest to lowest (descending) or lowest to highest (ascending) |
| Max participants | Limit how many participants to show (0 means show all) |
| Show images | Display participant profile pictures |
| Show names | Display participant names |
| Show scores | Display the numeric scores |
Styles
Section titled “Styles”| Setting | What it does |
|---|---|
| Bars color | Choose the color for the ranking bars |
| Font color | Choose the color for participant names and text |
| Font size | Set text size to small, medium, or large |
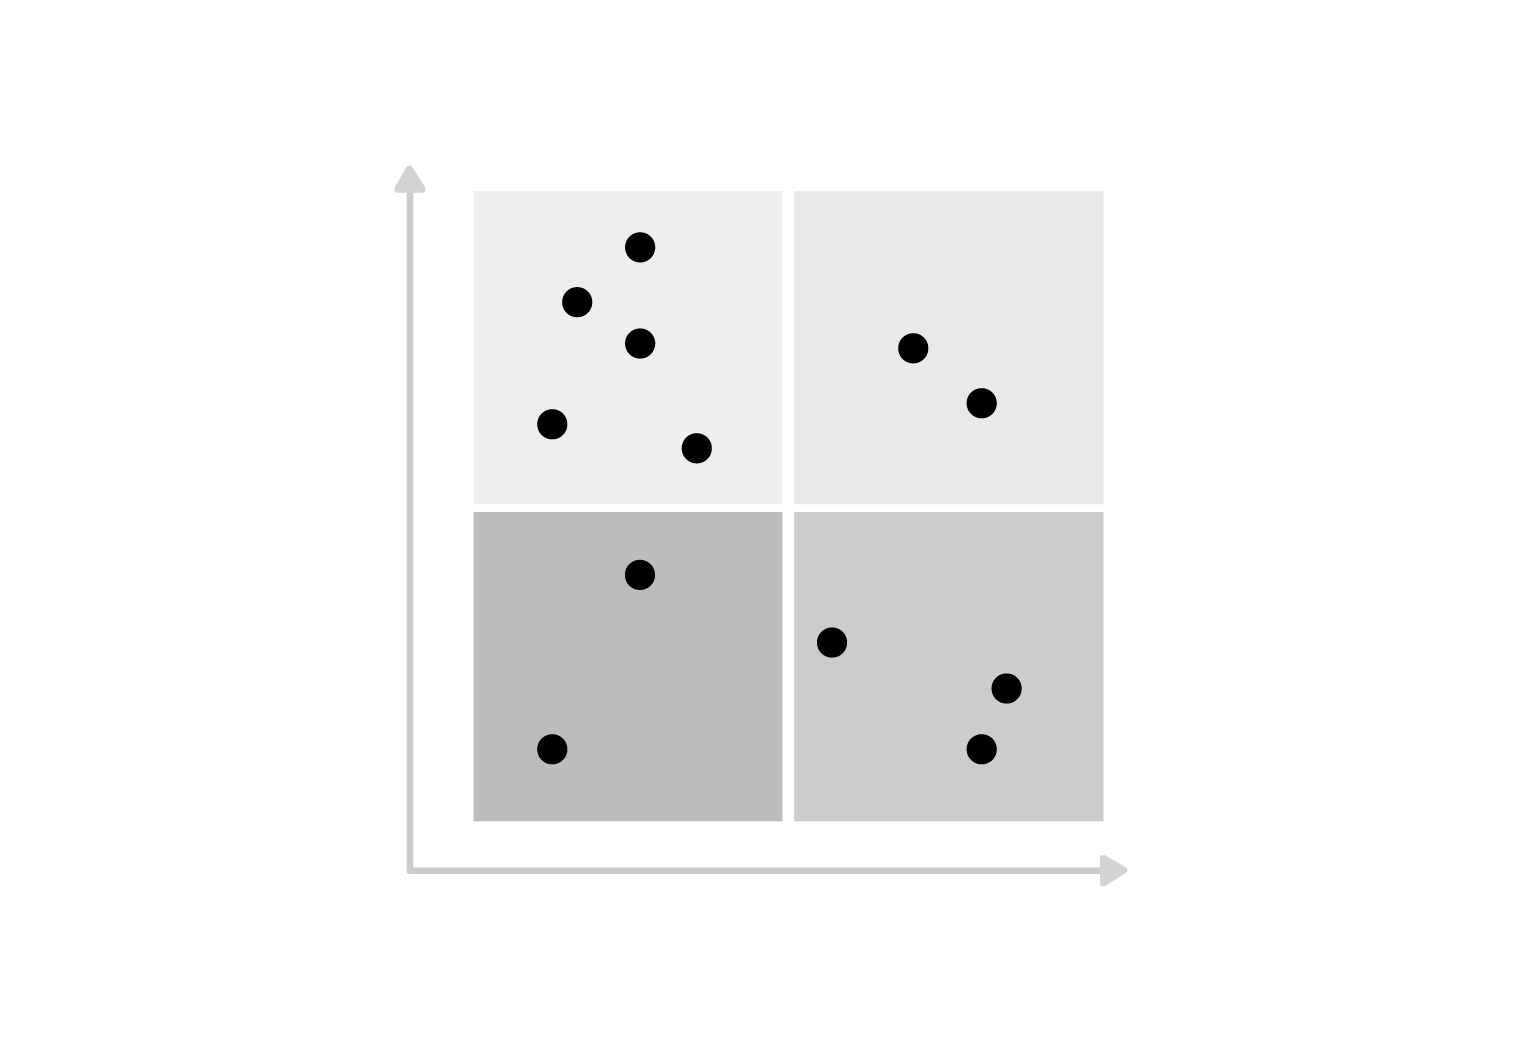 Scatter Plot
Section titled “ Scatter Plot”Use a scatter plot to show the relationship between two different measurements. Each point represents one participant’s answers to two questions. When using multiple datasets, all datasets are shown in an aggregated form. Clicking on a data point for a specific dataset reveals the individual answers that were aggregated to that point.
Inputs
Section titled “Inputs”Compatible answer items for both X and Y axes: Slider, Number, Range
Also supports for both axes: Computed values, Data bins
Multiple datasets: The scatter plot supports showing multiple datasets on the same chart. When multiple datasets are used, points are aggregated by dataset, and clicking on a point reveals the individual participant answers that make up that aggregated point.
Settings
Section titled “Settings”| Setting | What it does |
|---|---|
| Axes labels | Customize the labels for the X and Y axes |
| Background type | Choose between quadrants (four sections), diagonal lines, or no background |
| Marker type | Display points as dots or as participant profile pictures |
| Point size | Adjust how large the points appear |
| Show tooltips | Display information when hovering over points |
| Show identity line | Draw a diagonal line where X equals Y |
| Show fit line | Draw a line showing the general trend of the data |
| Show dataset title | Display a title if you have multiple datasets |
Styles
Section titled “Styles”| Setting | What it does |
|---|---|
| Quadrant colors | Choose colors for the four background sections |
| Dot color | Choose the color for the data points |
| Axis color | Choose the color for the chart axes |
| Text color | Choose the color for text labels |
| Font size | Set text size to small, medium, or large |
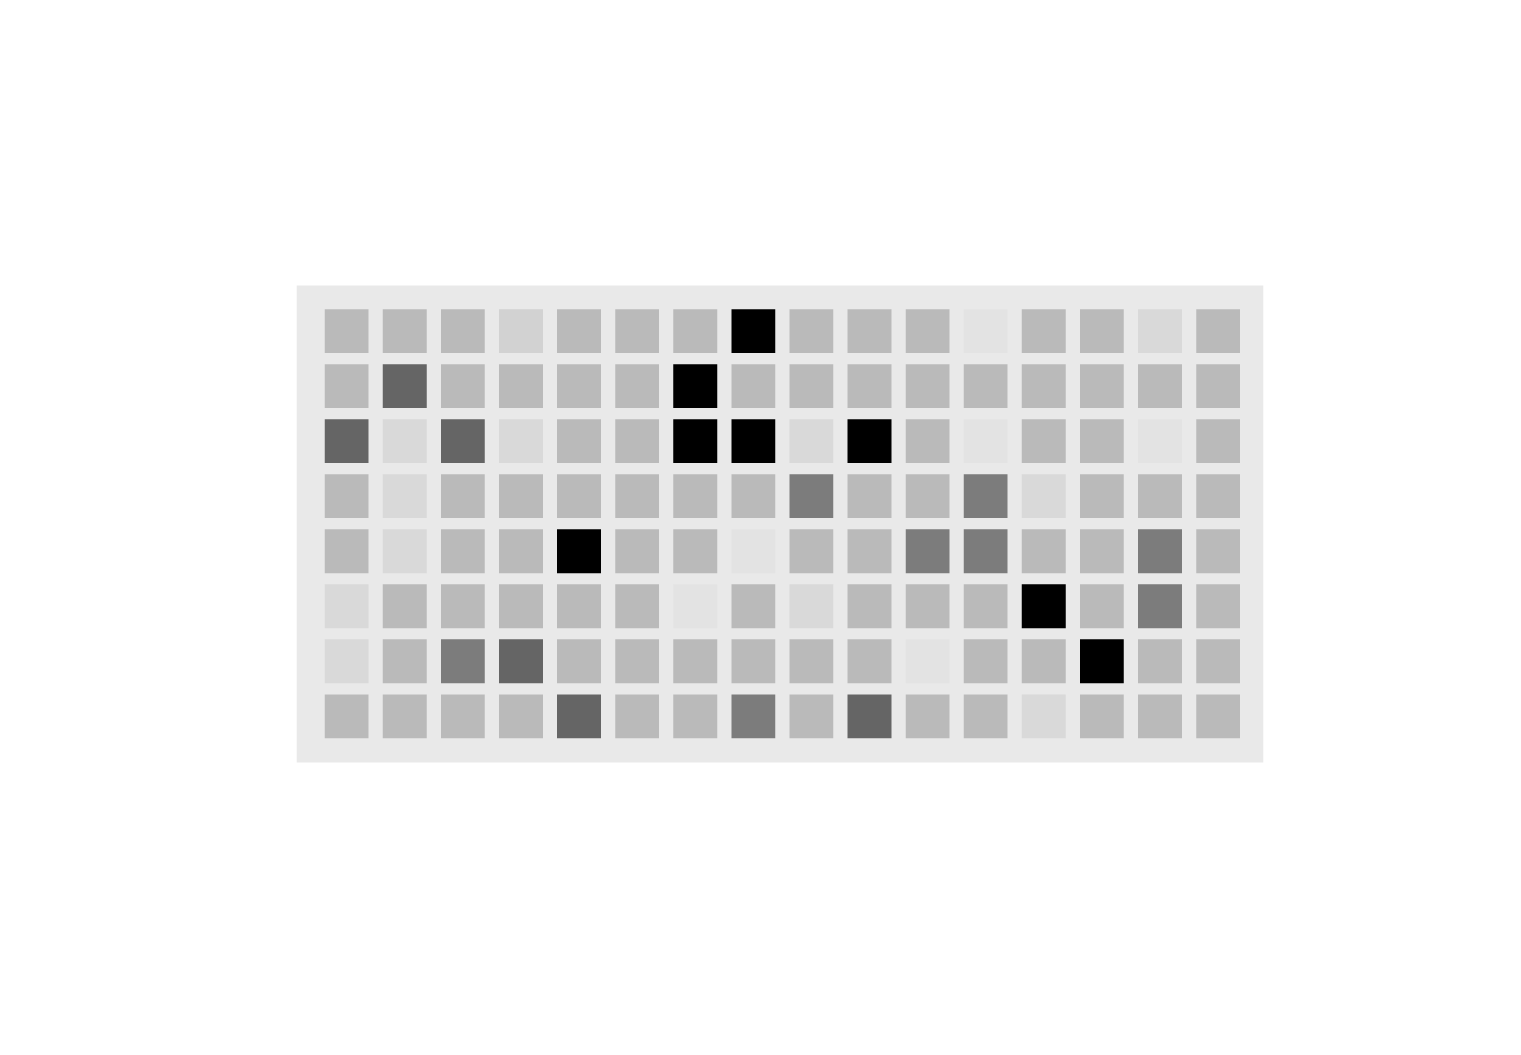 Heatmap
Section titled “ Heatmap”Use a heatmap to show patterns in data over time or across categories using color intensity. Darker colors typically represent higher values.
Inputs
Section titled “Inputs”Compatible answer items: Range
Also supports: Computed values, Data bins
Styles
Section titled “Styles”| Setting | What it does |
|---|---|
| Font size | Set text size to small, medium, or large |
Use a scale to show where a value falls on a predefined range with different levels or zones. This is useful for showing calibration, confidence levels, or performance categories.
Inputs
Section titled “Inputs”Compatible inputs: Computed values, Data bins
Settings
Section titled “Settings”| Setting | What it does |
|---|---|
| Show values | Display the numeric values on the scale |
| Show labels | Display the level names (like “Well Calibrated” or “Overconfident”) |
| Show levels | Display the level numbers |
Styles
Section titled “Styles”| Setting | What it does |
|---|---|
| Track border color | Choose the color for the border around the scale track |
| Highlight color | Choose the color for the highlighted section |
| Text color | Choose the color for text labels |
| Highlight text color | Choose the color for text on highlighted sections |
| Font size | Set text size to small, medium, or large |
 Open Ended
Section titled “ Open Ended”Use an Open Ended graph to display textual responses from participants arranged in a grid layout.
Inputs
Section titled “Inputs”Compatible answer items: Text, Country
Styles
Section titled “Styles”| Setting | What it does |
|---|---|
| Box background | Choose the background color for each response box |
 Word Cloud
Section titled “ Word Cloud”Use a Word Cloud graph to visualize textual responses as a cloud of words, where word size represents frequency.
Inputs
Section titled “Inputs”Compatible answer items: Text, Country
Styles
Section titled “Styles”| Setting | What it does |
|---|---|
| Text color | Choose the color for the words |
| Font scale | Adjust the overall size scale of the words (10-50) |
 World Map
Section titled “ World Map”Use a world map to show geographic data, displaying which countries or regions participants selected or are associated with.
Inputs
Section titled “Inputs”Compatible answer items: Country
Settings
Section titled “Settings”| Setting | What it does |
|---|---|
| Focus map | Automatically zoom to show only the regions relevant to your data, hiding the rest of the world map |
Styles
Section titled “Styles”| Setting | What it does |
|---|---|
| Map color | Choose the background color for countries not in your data |
| Border color | Choose the color for country borders |
| Highlight color | Choose the color for countries that appear in your data |